Well, only up to $75,000. A study published in PNASProceedings of the National Academy of Sciences on September 7th (online early edition) finds that the more money you make, the more satisfied you are with your life. However, improvement in happiness maxes out at an income of about $75,000.
The Gallup Organization surveyed ~450,000 Americans in 2008 and 2009 with questions aimed at assessing the overall well-being of Americans. Researchers then analyzed the data in an effort to evaluate what factors contribute to “emotional well-being” and “life evaluation”. These two concepts sound similar, but the subtle difference between them is important:
Emotional well-being refers to the frequency and intensity of positive and negative feelings (i.e., joy, fascination, affection, anxiety, sadness, anger). Someone who has a good emotional well-being experiences more positive emotions and less negative emotions on a day-to-day basis.
Life evaluation, on the other hand, has less to do with emotions and refers more to how a person rates their own life. Ebenezer Scrooge might give himself an A+ at life (he is “successful” – lots of money), but he probably doesn’t experience feelings of joy, fascination, and affection very regularly. Thus, life evaluation is not necessarily the same as happiness.
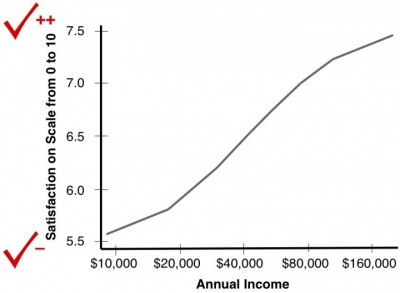
Life Evaluation Versus Income. The Gallup survey asked Americans how satisfied they were with their lives on a scale from 0 to 10, where 0 was “the worst possible life for you” and 10 was “the best possible life for you”. A significant correlation between household income and life evaluation was apparent (see graph below), indicating that richer people feel more satisfied with their lives.

A couple of things are worth noting about this graph. First, annual income is plotted on a logarithmic scale; that is, each increment is double the previous increment rather than being a fixed dollar amount. The rationale for this is based on Weber's lawPeople tend to perceive changes in quantity/intensity based on percent change, not absolute amount. (link), but the general idea is that a $10,000 raise means a lot more for someone making only $20,000 per year than for someone making $200,000 per year. The second thing to note is that although poor Americans aren’t as satisfied as rich Americans, they’re still pretty satisfied (>5 on a scale from 0 to 10). The Gallup World Poll (a related worldwide survey) indicates that the US ranks 9thAbove the US are the Scandinavian countries, Canada, The Netherlands, Switzerland, and New Zealand in terms of the population’s satisfaction with life.
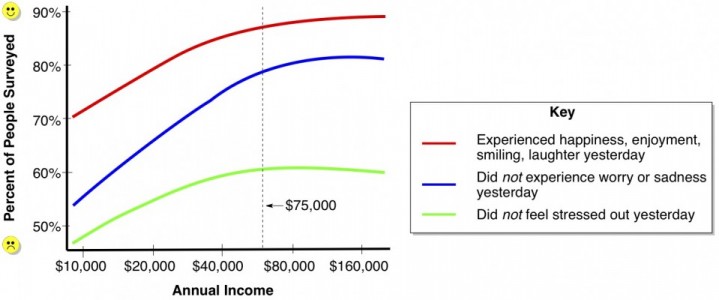
Emotional Well-Being. The Gallup survey also asked Americans yes-or-no questions related to the emotions that they experienced the previous day. The graph of emotional well-being versus income starts off looking similar to the life evaluation graph, but happiness seems to taper off at about $75,000.

Why $75,000? The researchers speculate that perhaps beyond $75,000, more money has a neutral effect on one’s ability to do things that bring happiness (e.g., spend time with friends and family, stay healthy). Alternatively, perhaps the emotional benefits of earning more than $75,000 are balanced out by negative effects (such as the inability to appreciate small pleasures). About a third of American households fall into this income category of making more than $75,000.
Specific Trends. Several other interesting trends were found in this survey, summarized below:

The paper on this research is chock-full of statistical analyses and interesting discussions. If you would like to read it in detail, it is published as an open-access articleA free article available to the public; no subscription necessary (doi:10.1073/pnas.1011492107).


Very interesting. I wonder if identical studies have been done during other time frames. 2008-9 was the heart of the recession. Severe recessions like that cause people to value money more than is typical. I know it’s done that for me, and I rarely think about money at all. Think of all the stress caused by the threat of unemployment and fear of losing your home. I’d like to see what the same study looked like during 2004-5, the most recent boom years.